


One way to get glimpse of that is this page:My guess is that you'd see a huge shift in population southward, away from snow.
By the Grid: Population Shift to the West and South
Weekly data visualization from the U.S. Census Bureau looks at historical population shifts to the South and West from 1790 to 2010. http://go.usa.gov/YNJF
www.census.gov
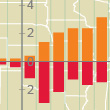
You can move the slides along the bottom to see various years. The bars represent what percent of the population at the time lived above or below, and left or right, of the lines.
It's easier to see changes if you move the slider yourself. But here's 1960:
And 2010 (newest data):
 .
.
")